Visibility:
Arista EOS provides unprecedented visibility for rapidly identifying and troubleshooting application and performance problems with tracers such as VM Tracer and MapReduce Tracer. EOS integrates with Apache Hadoop systems to track big data workloads, aggregates and monitors business critical applications across thousands of devices, and provides deep visibility and integration with virtualization platforms such as VMware vSphere.
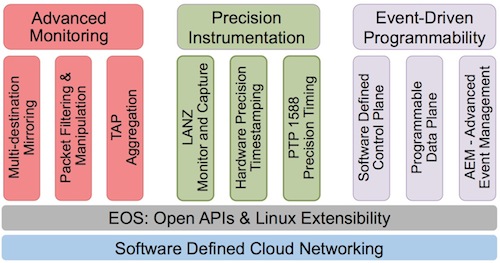
Arista EOS also simplifies Tap Aggregation with the Arista Data Analyzer (DANZ) feature set. For organizations with compliance requirements to aggregate and capture traffic, Arista EOS enables traffic collection at high data volumes with minimal infrastructure investment and without impacting network performance.
Featured Video: Application Visibility
Simplify Tap Aggregation with Arista DANZ
With Arista DANZ, organizations that have requirements to perform critical analytical and monitoring functions with increasingly higher data volumes and higher network bandwidths can maintain security, compliance and reporting for all traffic without the addition of proprietary out-of-band monitoring infrastructure or backhaul networks.
- Meet security, compliance and reporting requirements even for high data traffic and network bandwidth environments
- Apply advanced filtering and precision time stamping at wire rate in hardware
- Integrate with any standard 3rd party API and Application/Network management tools
Track real time congestion with Arista LANZ
Arista Latency Analyzer or LANZ is a breakthrough technology from Arista that tracks sources of congestion and latency with real time reporting in microseconds. With LANZ the network operations teams and administrators can know if 'microbursts' are really happening and enable intelligent traffic routing decisions at the application layer.
- Know the answer to the question : Is the network slow?
- Track sources of congestion in real-time
- Integrate network performance into applications and middleware
Manage application to network complexity with Tracers
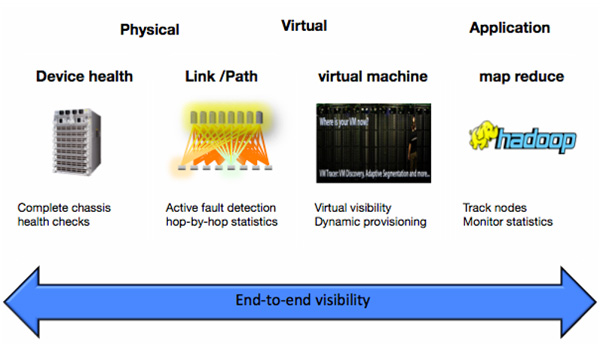
Arista’s network tracers provide visibility between network infrastructure and critical business applications to monitor and troubleshoot performance.
- VM tracer gives visibility from the virtualized infrastructure to the physical network for troubleshooting and dynamic provisioning.
- MapReduce tracer tracks and interacts with Hadoop workloads directly connected to Arista switch cluster for faster rebalancing during link congestion and recovery due to a node failure.
- Network-focused tracers, health tracer and path tracer, monitor the switches and network traffic at the path level.
LANZ:
Know More: With Arista LANZ Track Real Time Congestion
- Know the answer to the question : Is the network slow?
- Track sources of congestion in real-time
- Integrate network performance into applications and middleware
Featured Video: Overview of LANZ
Arista Latency Analyzer or LANZ is a breakthrough technology from Arista that tracks sources of congestion and latency with real time reporting in microseconds. Historically if 'the network was slow' administrators would attach a probe/collector and hope the problem happened again. No longer. With LANZ you will know when congestion happened, track the sources of congestion, and be able to export real-time events to external applications like Solace Systems middleware. This enables the application layer to make intelligent traffic routing decisions with unprecedented visibility into the network layer.
A key application of integrated LANZ is for the financial services market where trading plant performance is key. With LANZ the network operations teams and administrators will have more visibility than ever before into the network and know if 'microbursts' are really happening or not. With sub-millisecond reporting intervals, congestion can be detected and application-layer messages sent faster than some products can forward a packet.
DANZ:
Simplify Tap Aggregation with Arista DANZ
Arista Data ANalyZer (DANZ) is an integrated feature set of Arista's Extensible Operating System and is currently available on Arista Networks 7150, 7280E and 7500E Series switches. DANZ provides a solution to monitoring and visibility challenges at 10/40Gbps and higher with unmatched price-performance and precision. The Arista DANZ software features give IT operations and planning departments the following capabilities:
- Aggregate, replicate and capture traffic for processing without affecting production
- Apply advanced filtering and precision time stamping at wire rate in hardware
- Monitor, capture and correlate congestion and microburst events in real time
- Deliver application layer feedback directly to applications and tools
- Integrate with any standard 3rd party API and Application/Network management tools
- Achieve all of these features in Arista's full featured switches without additional equipment
Arista DANZ Framework
With Arista DANZ, organizations that have requirements to perform critical analytical and monitoring functions with increasingly higher data volumes and higher network bandwidths can maintain security, compliance and reporting for all traffic without the addition of proprietary out-of-band monitoring infrastructure or backhaul networks. Troubleshooting applications and performance problems, performing traffic interception when required (such as for Lawful Intercept or compliance), and managing overall customer satisfaction and response times can be accomplished cost-effectively with limited new investment and using existing tools.
Network Telemetry:
Network telemetry provides linkages between the infrastructure and application, exposing critical real-time information and enabling network aware applications. Utilizing a differentiated tool set completely unique to Arista EOS enabled devices, the network is able to actively monitor, detect and notify when issues are detected. Network telemetry is a new model that streams data about network state, including both underlay and overlay network statistics, to applications from Splunk, ExtraHop, Corvil and Riverbed.
- Differentiated tools provide both current and historical archive
- Coordinated actions across the infrastructure and applications
- Proactive notifications allows the network to tell you when there is an issue
Featured Video: Network Telemetry
In addition to proactive detection, records are kept providing a historical archive of all changes to the network forwarding state as well as link utilization thresholds. This ‘point in time’ information allows the data center administrators the ability to look back and determine if the network was experiencing issues. These powerful tools provide the keys to problem isolation and root cause analysis, no other operating system in the industry provides this level of resolution.
Network Tracers:
Network Telemetry is one Arista's three Network Applications. It provides a linkage between the network infrastructure and critical business application performance ensuring visibility into critical real-time information.
Arista's Network Tracers are enhancements to the Network Telemetry application that bring deeper application level visibility by integrating with distributed applications like big data, cloud and virtualized environments.
Network Tracers for virtual to physical to application visibility are:
- Health Tracer: EOS Health Tracer enables infrastructure resiliency at the hardware and software layer to increase overall service availability across all EOS platforms.
- Path Tracer: EOS Path Tracer is a network monitoring and analysis tool that monitors all paths in the active-active Layer 2 and ECMP networks.
- VM Tracer: EOS VM Tracer allows the network engineer to have visibility into virtual infrastructure as well from the physical switch.
- MapReduce Tracer: EOS MapReduce Tracer tracks and interacts with Hadoop workloads directly connected to Arista switches in a cluster ensuring faster rebalancing and recovery in case of a node failure or congested link.
- Latency Analyzer (LANZ) Tracer: LANZ Tracer enables the application layer to make intelligent traffic routing decisions by giving unprecedented visibility into the network layer. It enables support for precision congestion analysis in the network itself. With the help of LANZ Tracer, one is able to identify when microbursts occur in the network, for what applications they occurred for, and what applications got affected.
Media:
DANZ - Media
Network Telemetry - Media
Network Tracers - Media
